Quantcast
Channel: Business Intelligence y Big Data: ¡Aprende Gratis sobre Analytics!
Viewing all 575 articles
Browse latest View live

Lanzamiento de Jedox 7 y Novedades

$
0
0

Se acaba de presentar la versión 7 de una de las mejores soluciones para Planificación y Presupuestación Financiera y de Ventas, Jedox 7

Apúntate al webinar gratuito en español para el próximo 13 de Diciembre de 15:30h a 17:30h


A continuación, te contamos las novedades, mejoras, etc... En este enlace tienes otros posts que hemos publicado sobre Jedox


Press Release oficial sobre el lanzamiento

Jedox 7:

- Web en inglés con las novedades en Jedox 7

Jedox 7 is a true game-changer: Download our free "What's New" whitepaper and get all the details on smart modeling tools that bring your planning quickly up to speed, new design capabilities, enhancements to our innovative GPU technology, and so much more.


Jedox Models: Planning Made Simple

We are proud to introduce four all-new Jedox Models for Profit & Loss, Cost Center, Sales and Human Resources.

In 2017, Jedox and their partners will continue to provide a growing portfolio of these predefined and configurable planning applications through the new Jedox Marketplace. 

Discover how you can kickstart and improve your planning processes with our new Jedox Models.

Jedox Models 


7 Ejemplos y Aplicaciones practicas de Big Data

$
0
0

En las siguientes Aplicaciones, Cuadros de Mando y ejemplos podéis ver el funcionamiento práctico del Big Data en diferentes casos y usando diferentes tecnologías: Kafka, Spark, Apache Kylin, Neo4J....

Acceder a los ejemplos

Si quieres saber más de Big Data, te pueden interesar estos enlaces:

OLAP for Big Data. It´s possible? 
Como empezar a aprender Big Data en 2 horas
List of Open Source Business Intelligence tools
Analysis Big Data OLAP sobre Hadoop con Apache Kylin (spanish)
Caso de uso de Apache Kafka en tiempo real, Big Data
 (spanish)


Available new Open Source OLAP viewer, STPivot4

$
0
0


STPivot4 is based on the old Pivot4J project where functionality has been added, improved and extended. These technical features are mentioned below.


GitHub STPivot4
For additional information, you may visit STPivot4 Project page at http://bit.ly/2gdy09H

Main Features:
  • STPivot4 is Pentaho plugin for visualizing OLAP cubes.
  • Deploys as Pentaho Plugin
  • Supports Mondrian 4!
  • Improves Pentaho user experience.
  • Intuitive UI with Drag and Drop for Measures, Dimensions and Filters
  • Adds key features to Pentaho OLAP viewer replacing JPivot.
  • Easy multi-level member selection.
  • Advanced and function based member selection (Limit, Ranking, Filter, Order).
  • Let user create "on the fly" formulas and calculations using
  • Non MDX gran totals (min,max,avg and sum) per member, hierarchy or axis.
  • New user friendly Selector Area
  • and more…


Las predicciones de Pentaho para 2017

$
0
0


Ver una Demo Online de Pentaho CE
  • Self-service data prep will unlock big data’s full value. Organizations building advanced, big data deployments like the ones needed to accurately predict election outcomes are buckling under huge, diverse data volumes. The amount of time spent simply preparing data is overwhelming organizations struggling for resources and time. This is often to the tune of anywhere between 50-70% of IT time spent preparing data. That sentiment data I mentioned only exacerbates this problem needing to be continually ingested from a huge universe of social network feeds and prepared for analysis. Self-service visualization tools that can only analyze data after it’s been prepared are diminishing in value. Our customer Sears Holdings does spot checks and visualizes its data throughout its lifecycle, which enables it to make more valuable data-driven decisions - in time for them to matter - while reducing costs. Expect more software vendors in 2017 to follow our lead and start offering tools that bridge the gap between analytics and data prep with an integrated experience for both.

  • Organizations are replacing self-service reporting with embedded analytics. As I first predicted in 2015, embedded analytics would become ‘the new BI’. We are now really starting to see our vision of ‘next generation applications” mature and replace self-service reporting. Organizations can see that analytics are an expectation and must be embedded at the point of impact regardless of the end-users sophistication. In our customer CERN’s case, this involves 15,000 users in various operational roles accessing Pentaho analytics from their normal line-of-business applications.

  • IoT’s adoption and convergence with big data will make automated data onboarding a requirement. This year predictive maintenance became a marquis use case for IoT’s ROI potential and this will continue to gather speed in 2017. Everything from shipping containers to oil-drilling screws to train doors is being fitted with sensors to track things like location, operating status and power consumption. And speaking of trains, expect to hear more about our project with Hitachi Rail to build ‘self-diagnosing’ trains that can detect if a problem is brewing on a train to either be taken out of service or repaired before the failure has taken place. In order to ingest, blend and analyze the massive volumes of data all these sensors generate, more businesses will need to be able to automatically detect and onboard any data type into its analytics pipeline. This is simply way too big, complex, fast-moving and mind-numbing a job for overburdened IT teams to handle manually

  • 2017’s early adopters of AI and machine learning in analytics will gain a huge first-mover advantage in the digitalization of business. Big data and IoT use cases in business and industry are approaching the data variety, volume and velocity levels of large-scale scientific models for which AI and machine learning were originally conceived. Early adopters gain a jump start on the market in 2017 because they know that the sooner these systems begin learning about the contexts in which they operate, the sooner they will get to work mining data to make increasingly accurate predictions. This is just as true for the online retailer wanting to offer better recommendations to customers, a self-driving car manufacturer or an airport seeking to prevent the next terrorist attack.

  • Cybersecurity will be the most prominent big data use case. As with election polls, detecting cybersecurity breaches depends on understanding complexities of human behavior. Accurate predictions depend upon blending structured data with sentiment analysis, location and other data. BT’s Assure Cyber service, for example, uses Pentaho to help detect and mitigate complex and sustained security threats by blending event data and telemetry from business systems, traditional security controls, advanced detection tools among others.


Location Intelligence for Indoor Maps

$
0
0

Carto, herramienta de visualización Geoespacial de la que somos partners. En esta aplicación de análisis de tráfico en 'near real time', la podéis ver en funcionamiento junto a Pentaho, lanza una funcionalidad muy interesante:

Análisis Business Intelligence en ubicaciones (Location Intelligence) indoor (es decir, grandes oficinas, centros comerciales, universidades, edificios públicos o deportivos, etc...). Las posibilidades son enormes.

Nuestros compañeros de Carto nos indican:

"Indoor maps often direct users to emergency exits, which has limited our context of mapping to external geographical spaces. With the rise of Indoor Positioning Systems (IPS), however, the field of data visualization is turning inward to pioneer new paths to purchase with indoor maps.


Situm, a member of Telefónica’s Open Future initiative, and known as the “GPS for indoor” start-up, analyzes indoor traffic for various sectors using location intelligence. Despite an exponential rise in mobile purchasing, the Department of Commerce reports that 90 percent of retail purchases are transacted offline, which means managing in-store traffic is crucial to maintaining a competitive edge. But aside from providing directions for customers, what, exactly, can IPS offer? Well, as we learned during a recent collaboration with Situm, the answer is a lot"


A quick review of STPivot4 Open Source OLAP tool

$
0
0

STPivot4 Open Source OLAP tool                               

STPivot4 is based on old Jpivot and Pivot4J projects, now not in progress, where we´ve included, improved and strengthened many new functionalities mentioned below as technical features.

STPivot4 includes an innovative work space for selecting your query that allows end users work easily using drag and drop. End user can identify quickly which dimensions, measures or filters in order to work with them.  Now, you can search, filter, rank and select in order to refine your queries as a first approach previous a query, avoiding waiting for long query response times. 
Has been improved design, usability, graphs and, in summary,  easy to use and manage for end users.

STPivot4 supports Mondrian 4, so it allows grant scalability, compliance and performance improvements and, working as a Pentaho plugin, working wih last available Pentaho versions.


Main Features and Download

You can download open source code from Github. We´ll be grateful of helping you in your Business Intelligence projects using Open Source tools if you need support, development and consultancy. We´d like to receive your feedback: info@stratebi.com


  • Cube Selector

    We've created a new popup window where end users can  easily select dimension values, measures, levels... for their queries. It includes a new search feature that improves value selection with high cardinality dimensions. 
    In your design window, end users can drag and drop their dimensions, filters and measures quickly and easily. 

  • New search functionality

    One of the best new features of STPivot is the ability of search dimension values easily, when you manage a great number of values.
    This is very helpful when you need to identify your desired values on each level/dimension/hierarchy in order to include them in our query result. 

  • Drag and Drop query design and build 

    If sometime you wanted to build your queries easily and quickly, with this visuall drag and drop design now it´s possible. 

  • Filter and drill to detail

    One of the best functionalities of any OLAP Viewer is the possibility of drill through any dimension and measure in order to get powerful insights about yor data models.

  • Advance Filters

    It´s included advance filters within the Selector, so you can leverage all the power of OLAP cubes, refining your queries and nesting each filter. 

     Ranking Top Count 
     Ranking Bottom Count
     Order 
     Visual Totals
     Filter 
     Limit First/Last

  • Graphics and Visualization 

    STPivot includes a great variety of graphic libraries (pie, chart, heatmaps, line, bar...) fully configurable with popup information for any of your analytical needs. 


  • Calculator

    All the simplicity and power for end users, so they can directly create their own formulas with a friendly interface, in order to include them in their OLAP views. 

Roadmap

We are working on new functionalities for STPivot. Some of them are listed below: 

  •  Creación de Formulas complejas 
  •  Creación de miembros calculados para uso en consultas 
  •  Analysis Wizard 
  •  What If 
  •  Undo Feature 
  •  Mejoras en usabilidad, diseño, resolución de problemas conocidos, etc... 
  •  New 'cool' ideas... 


Google open sources Embedding Projector for high-dimensional data

$
0
0


Good news for open source data visualization fans: Google open sources Embedding Projector for high-dimensional data

The tool will help machine learning researchers to visualize data without having to install and run TensorFlow.
Dimensionality, and vectors in general, is not something that most of us find easy to understand. 
The problem is that we all live in a three-dimensional world. We are taught length, width and height, so we struggle to imagine what a forth, fifth or sixth dimension might look like — this is why most of us found Christopher Nolan’s representation of additional dimensions wonky in the movie Interstellar.


To enable a more intuitive exploration process, they e are open-sourcing the Embedding Projector, a web application for interactive visualization and analysis of high-dimensional data recently shown as an A.I. Experiment, as part of TensorFlow
They are also releasing a standalone version at projector.tensorflow.org, where users can visualize their high-dimensional data without the need to install and run TensorFlow.

iD v2 is now available on OpenStreetMap

$
0
0


The web-based iD editor is designed to help create an even better, more current OpenStreetMap by lowering the threshold of entry to mapping with a straightforward, in-browser editing experience.

Head over to OpenStreetMap and start editing today! You can make meaningful contributions with just a few minutes of training.
You can also help OpenStreetMap by donating to the OpenStreetMap Foundation’s 2016 funding drive. Donate today and your gift will go even further because Mapbox is matching €10,000 of donations.
Check out iD on Github to contribute code, make suggestions, or report an issue.

Santander y BBVA trasladan su competencia al Business Intelligence

$
0
0
Tanto el Banco Santander como BBVA, trasladan su competitividad al Business Intelligence. Decimos Business Intelligence, en lugar de Big Data, como suelen promocionar, pues ambas aplicaciones, de momento, tienen más de lo primero que de lo segundo. Probablemente, con el tiempo usen más de lo segundo

La cuestión es: Tendrá éxito realmente entre los comercios? Están preparados y formados para usar herramientas de Business Intelligence?

Os contamos:

La de Santander se llama: Mi Comercio


Mi Comercio cuenta con tres funcionalidades básicas:
  • ‘Mi Facturación’ recoge las totalizaciones realizadas por los TPVs en los últimos 15 días, incluyendo el detalle de estas operaciones.
  • ‘Mis Clientes’ recopila mensualmente datos agregados de aquellos clientes nuevos y recurrentes que han comprado en el comercio y en los de la competencia cercana. Con esta información, las empresas y los autónomos pueden tomar decisiones de negocio al acceder a información como la hora del día a la que más compran sus clientes, si están captando más clientela que su competencia,  en qué otros sectores de actividad suelen comprar las personas que acuden a sus negocios, etcétera.
  • ‘Ayuda y Soporte’, responde a las preguntas más frecuentes de los clientes y ofrece los teléfonos de atención para los usuarios de TPVs a un solo click.


La del BBVA se llama: Commerce 360


  • Accede mes a mes a los datos de compras de tu TPV BBVA y compáralos con la actividad comercial de las empresas de tu zona y sector para tomar decisiones útiles para tu negocio.
  • Te ofrece datos objetivos sobre de la fidelidad de tus clientes, de sus segmentos demográficos y de sus principales códigos postales de procedencia.
  • Compara estos indicadores con los de tu zona para identificar oportunidades de mejora en horarios comerciales, precios o acciones de marketing.
  • Todo esto sin coste por tener el TPV con BBVA.

New Search and Tags functionalities in Pentaho Console

$
0
0

Hi, if you are a Pentaho user or Admin, and you are managing a 'production environment' where the number of folders, reports, analysis and Dashboards increase day by day it's very useful a way to quickly identify the right element you want to open.

That´s why we´ve created this component that allows you to:

- Search by folder
- Add tags and comments for any element
- Search by any word of title, tags, and comments
- Select by any tag
- Search by date of creation or modification
- Filter by type of element: Report, OLAP or Dashboard

You can see in action here in this Online Demo


Select by Date of creation or modification


Select by type of element, tag, date and text search


Add tags and description


Conoce las novedades de Jedox 7 en este video

$
0
0

En este vídeo puedes ver una presentación de las novedades de Jedox 7, la mejor herramienta Business Intelligence para planificación, presupuestación, ratios, reglas de negocio y forecasts

Kylin, analisis OLAP sobre Big Data, viene con novedades para 2017

$
0
0
Cada vez es más factible poder realizar análisis OLAP sobre entornos Big Data, gracias a Apache Kylin, con visualización con Tableau, Pentaho, etc.... Si quieres saber más, pincha estos posts: OLAP for Big Data. It´s possible? y Analysis Big Data OLAP sobre Hadoop con Apache Kylin que hemos publicado recientemente

Hoy os traemos las novedades que para comienzos de este 2017 nos presentan (puedes preguntar a nuestros amigos especialistas de Stratebi para cualquier duda):

Principales características comunes de KAP

-          Interfaz gráfica: Modelado, construcción y consulta SQL del cubo a través de una interfaz web simplificada.

-          Soporte para la extensión mediante plugins

-          Despliegue no intrusivo: La instalación es totalmente independiente del clúster Hadoop y se comunica con dicho clúster a través de una API.

-          KyAnalyzer: Herramienta de análisis OLAP basada en Saiku Server que se incluye con Kyligence.

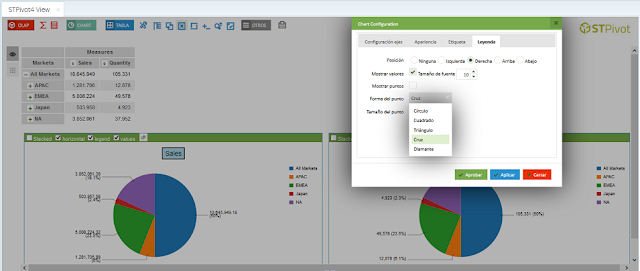
-          Integración con las principales herramientas de Business Intelligence: Gracias al soporte para conexiones ODBC/JDBC y una API rest, es posible conectar con herramientas como Tableu, Microsoft PowerBI, Apache Zeppelin, Saiku Server o Pentaho & STPivot.

-          Compatibilidad con las distintas versiones de Hadoop:
o   Apache Hadoop (Open Source Stack)
o   Distribuciones:
§  Hortonworks HDP
§  Cloudera CDH
o   Nube SaaS
§  Microsoft HDInsight
§  AWS EMR

-          KyStorage (Solo en versión Enterprise Plus): La versión Enterprise Plus utiliza un motor de almacenamiento propio, que sustituye a HBase. Características principales:
o   Rendimientos 12x más rápidos y una reducción del 50% del espacio de almacenamiento.

Permite hacer consultas sobre los datos en bruto (sin transformar a un esquema estrella, raw data). Esto facilita la exploración de los datos para el descubrimiento iterativo del modelo.


Comparativa de características de las versiones Enterprise y Enterprise Plus de KAP (Kyligence Analytic Platform) frente a Apache Kylin:


Apache Kylin
KAP
KAP Plus

Posicionamiento
Soporte para OLAP en Hadoop
Data Warehouse en Hadoop
Núcleo
Apache Kylin
Apache Kylin
Apache Kylin
Rendimiento de las consultas
Latencias de consulta inferiores al segundo
En 3 y 40 veces más rápido que Apache Kylin
Parallel Computing
Haciendo uso del Co - procesador de HBase
Spark
Storage Engine
HBase
HBase
KyStorage: Motor de almacenamiento columnar propietario
Raw Data Query
Limitado
Limitado
Soporte Eficiente
Security
Limitado
LDAP/Kerberos/cell level access control
BI Tool
No incluye herramienta de BI native, pero puede conectar con las principales herramientas BI del mercado: Tableu, Microsoft PowerBI, Apache Zeppelin, Saiku Server o Pentaho & STPivot
KyAnalyzer: Herramienta BI con integración nativa
Technical Support
Comunidad Open Source
Soporte 5*8 o 7*24
Soporte5*8 o 7*24
KyBot Self-Service
No incluido, pero se puede comprar por separado
Incluido
Incluido


Pila de productos de Kyligence Analytic Platform

Todos los productos de Kyligence hacen uso del núcleo Open Source de Apache Kylin. Sobre esta base han desarrollado 3 productos.


-          Apache Kylin: Núcleo de Kyligence. Sobre el núcleo añaden las últimas actualizaciones y bug fixes sobre la versión Enterprise.
o   Nota: Kyligence está formado por 6 PMC (Miembros del comité de proyecto) de Apache Kylin Open Source de un total de 13 PMC. De esta forma, muchos de los bug fixes van a llegar antes a KAP que a Kylin.

-  KyStorage & Plugin: Sobre el núcleo de Kylin se añaden las siguientes características
o   Características mejoradas de seguridad. Apache Kylin (Open Source) soporta la integración con LDAP y seguridad a nivel de modelo de dato (a nivel de cubo), añadiéndose las siguientes:
§  Integración con Kerberos
§  Seguridad a nivel de datos (celda)
o   Soporte para consultas OLAP sobre datos en Hive sin transformar (raw data): En Apache Kylin y KAP Enterprise es posible añadiendo subqueries de Hive a las queries principales sobre el cubo.
§  KAP Enterpise Plus: Soporte y eficiencia mejorada para el procesamiento de datos en bruto.

o   Almacenamiento columnar propio (solo en KAP Enterprise Plus): Apache Kylin y KAP Enterprise usan HBase para almacenar el cubo que se construye a partir de los datos en Hive/HDFS.
§  KAP Enterprise Plus utiliza un motor de almacenamiento propio, que sustituye a HBase, prometiendo rendimientos 12x más rápidos y una reducción del 50% del espacio de almacenamiento.

-  KyAnalyzer: Herramienta BI OLAP basada en Saiku Server que integra de forma nativa con KAP Enterprise y KAP Enterprise Plus. Es un Saiku Server personalizado que incluye la versión de Mondrian y el driver JDBC necesarios para la conexión con Kyligence.

-  KyBot: Herramienta de diagnóstico y soporte automatizado incluida en KAP Enterprise y Enterprise Plus. También es posible adquirirla por separado para usarla con Kylin Open Source. Incluye las siguientes características:
o   Cuadro de mando que nos permite analizar de un vistazo:
§  Estado del clúster Kylin
§  Rendimiento
§  Almacenamiento
o   Optimización: El sistema detecta automáticamente los problemas de rendimiento y propone optimizaciones para el diseño del modelo del cubo y el diseño/ejecución de las consultas sobre dicho cubo.
o   Documentación y guía para la resolución de problemas
o   Soporte: Incorpora herramientas para comunicarse con los expertos de Kylin y desarrolladores.


Data Visualization para FIWARE

$
0
0

FIWARE, es una plataforma, impulsada por la Unión Europea, para el desarrollo y despliegue global de aplicaciones de Internet del Futuro. 
FIWARE intenta proveer de una arquitectura totalmente abierta, pública y libre así como de un conjunto de especificaciones que permita a los desarrolladores, proveedores de servicios, empresas y otras organizaciones desarrollar productos que satisfagan sus necesidades, sin dejar de ser abierta e innovadora

Uno de los puntos importantes en esta plataforma es la Visualización de Datos y esta la proporciona la plataforma SpagoBI, de la que somos partners hace años y es Open Source


Ver el Catalogo de Fiware. Como podéis ver, contiene un gran número de componentes

Predictions: A Cynic’s Guide To BI In 2017

$
0
0

Genial esta descripción de Timo Elliot (uno de los mayores especialistas en Business Intelligence). No tiene desperdicio!!

Businesspeople

  • Businesspeople will be dissatisfied with their BI systems (this is “Timo’s First Law of BI”)
  • Executives will refuse to learn to use any other data tool than Excel (and not even the newer features of that).
  • No matter how good the BI system, businesspeople will make bad decisions based on gut feel.
  • Executives will be completely unaware of data quality problems—unless their bonus depends on some value affected by it, at which point they will become experts.
  • Businesspeople will find it hard to articulate what data they need—and then they will change their minds as soon as they get what they asked for.
  • Some businesspeople will get fed up with corporate BI and take it into their own hands. They will build a loosely connected set of different technologies, resulting in huge maintenance costs and low compliance. They will then ask IT to take over the project.

IT

  • IT teams will implement new ERP systems, then be surprised when businesspeople ask for analytics. Providing the analytics will require expensive changes to the ERP system.
  • IT teams will struggle to build business cases for BI. But as soon as the businesspeople have access to the new data, they will change processes, create new opportunities, and save millions. They will take all the credit for this.
  • “Download to Excel” will continue to be the most-requested BI tool feature. Users will complain when they are unable to download the entire corporate data lake to their PC.
  • Data quality, data integration, and metadata will be the primary barriers to BI. But companies will continue to invest less in these areas than in shiny executive dashboards.
  • New data sources will outpace IT’s ability to integrate them into core platforms (no matter what technology is used).
  • BI competency centers will over-invest in technical skills and under-invest in training, communications, and community-building.

Analysts

  • Some analysts will say BI and BI competency centers are dead, much to the confusion of the millions of people doing it every day.
  • Analysts will say that there is only 15% penetration of BI. Nobody will understand where this number comes from and why it hasn’t changed in over twenty years.
  • Analysts will say that data should be treated like an asset. Companies will not treat it like an asset.
  • BI success numbers will be “calculated” using non-scientific samples of self-reported estimates without defining what “success” means. Analysts will say these numbers are too low, and that you need help from analysts to improve them.

The market


  • Everybody will insist their definition of Business Intelligence/Analytics/Big Data, etc. is the only “correct” one.
  • New analytics buzzwords will be coined. Thousands of articles will be written saying that the new buzzwords are meaningless and/or wrong.
  • New BI startups will be created. They will claim to bring “BI to the masses” for the first time.
  • Newer vendors will call the older vendors inflexible dinosaurs. Older vendors will call newer vendors immature and unsafe. Some newer vendors will suddenly realize that they are now considered the older vendors.

Visto en Digitalistmag

Big Data, casos, tecnologias y aplicaciones reales

$
0
0

Os mostramos a continuación, una buena selección de ejemplos, tecnologías y casos aplicables de Big Data usando las principales tecnologías, con enfoque Data Lake, de la mano de los especialistas de stratebi


Open Source Business Intelligence Tips and Tricks in January 2017

$
0
0

Top 50 Business Intelligence Blogs Every BI Decision Maker Must Follow

$
0
0

Curso de Creacion de Dashboards con soluciones Open Source

$
0
0

Cada vez son más demandados los Cuadros de Mando y la buena noticia es que gran parte de ellos pueden hacerse con soluciones Open Source: Pentaho, CDE, dc.js...

Os incluimos las principales claves para construir potentes Cuadros de Mando, del Curso de creación de Dashboards Open Source:


Si os ha interesado, podéis también:

- Ver ejemplos en funcionamiento de Cuadros de Mando Open Source
- Ver Galería de Cuadros de Mando y Video Tutorial de Cuadros de Mando Open Source
- Ver temario y Cursos presenciales e 'in company' para crear cuadros de mando de forma práctica
- Ver Cuadros de Mando con tecnologías Big Data 'Real Time?


Es interesante el BI QuickSight de Amazon?

$
0
0

Como ya comentamos cuando se presentó, Amazon, al igual que Google, intenta acaparar todos los mercados, fruto de su alta penetración en muchos sectores y actividades

Ahora llega al Business Intelligence con su plataforma Quicksight. La verdad es que parece interesante al venir de Amazon, por su capacidad en la nube y competitividad en precio. Para los que llevamos tiempo trabajando con Business Intelligence, sabemos de la complejidad de estas soluciones, aunque se pretentan ofrecer como algo sencillo, de ahí que Amazon se apoye mucho en la integración, tanto con soluciones de front-end (todavía no disponible, como Tableau, Qlikview...), como con soluciones de ETL (Integracion de datos - Talend, Informatica...-)

Tiene un claro objetivo de ir 'atrapando' a los clientes dentro de su 'red' de soluciones para crear dependencia. Técnica ya conocida y empleado por Microsoft, Google, Oracle... y todas las grandes compañías con capacidad de crear dependencia

Todavía está en sus comienzos, pero habrá que estar atentos como madura

Os contamos:

What is QuickSight?

Amazon QuickSight is a fast, cloud-powered business analytics service that makes it easy to build visualizations, perform ad-hoc analysis, and quickly get business insights from your data. Using our cloud-based service you can easily connect to your data, perform advanced analysis, and create stunning visualizations and rich dashboards that can be accessed from any browser or mobile device.

Ver en accion:


Bouquet: Open Source Analytics API

$
0
0

Bouquet, is the open source analytics API used by developers for building analytics applications

Bouquet addresses the challenges faced by a developer designing a new analytics visualization. Bouquet includes a powerful Javascript SDK with a D3js component and enforces multiple levels of security to meet the needs of the enterprise.

Bouquet supports SQL-on-Hadoop frameworks such a Pivotal Hawq and Apache Drill, and soon SparkSQL and Presto, along with most relational databases. “Pivotal shares an open source vision of software and Bouquet is a powerful addition to the big data ecosystem.  


Its ease of integration enables the creation of secure, scalable data visualizations on top of the world’s leading Hadoop Native SQL, powered by PivotalHDB ,” said Michael Cucchi, Sr. Director, Big Data Product Marketing at Pivotal

Descargar Bouquet


Viewing all 575 articles
Browse latest View live