↧
Big Data, casos, tecnologias y aplicaciones reales

↧
Free tools for Pentaho

Our colleagues from Stratebi (analytics specialists), have developed a suite of tools for Pentaho or embed in your own application, that includes:
- Improvements in BI Server Console (search, tags...)
- OLAP viewer and Adhoc Reporting improved
- New tools for end users self service dashboarding
- New amazing scorecard solution on top of Pentaho stack
- Powerful predefined real time dashboards
- Integration with Big Data technologies
- Powerful predefined real time dashboards
- Integration with Big Data technologies
- They are free and you can get open source code
- They only charge support, training and maintenance in order to give you security using this tools in production environments avoiding bugs, including updgrade to new versions (contact with them)
↧
↧
Guia para Bases de Datos NoSQL

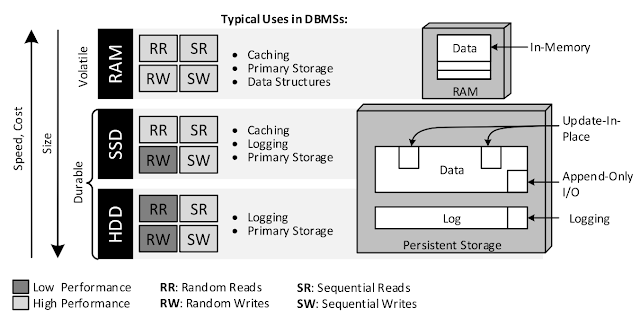
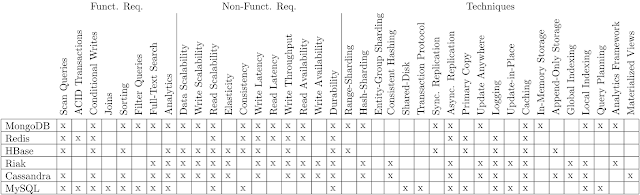
Muy interesante este articulo de Felix Gessert, donde nos ofrece una visión actualizada del paisaje actual de las Bases de Datos NoSQL y su aplicación según necesidades. Muy, muy recomendable!!
Os incluimos también una breve introducción en español al ecosistema NoSQL, que hicieron nuestros amigos de Stratebi. Siempre con el foco en su implementación real en proyectos y su vertiente analítica. Demos Big Data Online

Si os es útil y os gusta, no dejéis de darnos feedback para continuar con nuevos materiales

↧
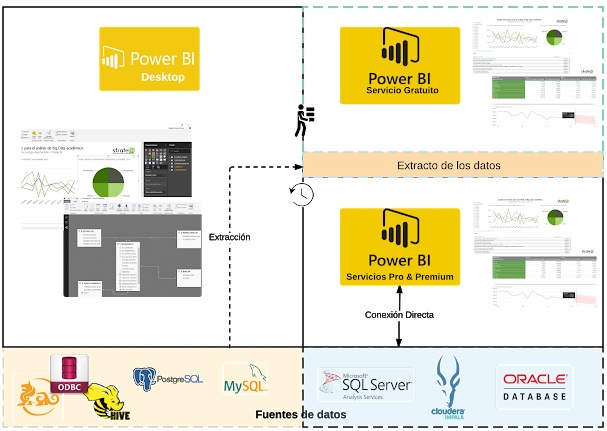
PowerBI: Arquitectura End to End
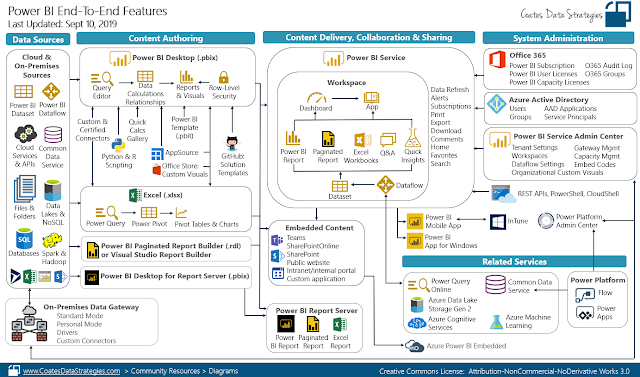
En el diagrama superior tenéis de forma actualizada, todo el ecosistema de PowerBI. Muy útil y clarificador
Saber más sobre PowerBI:
Use Case Big Data “Dashboards with Hadoop and Power BI”
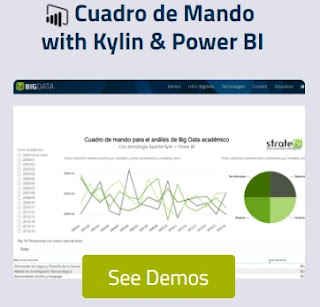
In recent posts, we explained how to fill the gap between Big Data and OLAP, using Tableau, Pentaho and Apache Zeppelin. Now, we´ll show you how to use PowerBI for Big Data Dashboards using Apache Kylin. Also try online in our Big Data Demo site Arquitecture: In this use case we have used together Apache Kylin and Power BI to support interactive data analysis (OLAP) and developing a dashboard, from data source with Big Data features (Volume,...
Todas las presentaciones del Workshop ‘El Business Intelligence del Futuro’
Hace unas semanas, se celebró en Madrid el Workshop ‘El Business Intelligence del Futuro’, que organizamos desde TodoBI, con toda la sala repleta En el, podías conocer las tecnologías líderes de integración, base de datos y visualización de Data Lakes (Talend, Vertica, PowerBI, Big Data, LinceBI...), de la mano de fabricantes, empresas que las utilizan y especialistas Agenda: 0. Introducción al Workshop 1. Big Data Analytics:...
Como funciona Microsoft Power BI? Todo lo que necesitas saber

Todo lo que necesitas saber sobre la herramienta de Data Discovery que está revolucionando la toma de decisiones en las empresas lo tienes aquí: Para saber más de PowerBI (ver demos online en enlace anterior, cursos e info a continuación): Big Data para PowerBI febrero 19, 2019 big data, lincebi, open source, Pentaho, powerBi 4 comments Power BI es un conjunto de herramientas...
Big Data para PowerBI
Power BI es un conjunto de herramientas Business Intelligence (BI) desarrolladas por Microsoft. De reciente aparición, gracias a su simplicidad y potencia se ha hecho un un hueco entre las grandes del mercado como Tableau, Pentaho o Microstrategy. Al igual que estas últimas, implementa la filosofía de Autoservicio para el usuario final (Self Service BI) llevada al extremo de la sencillez, pero con un gran número de características...
Usando Python con PowerBI
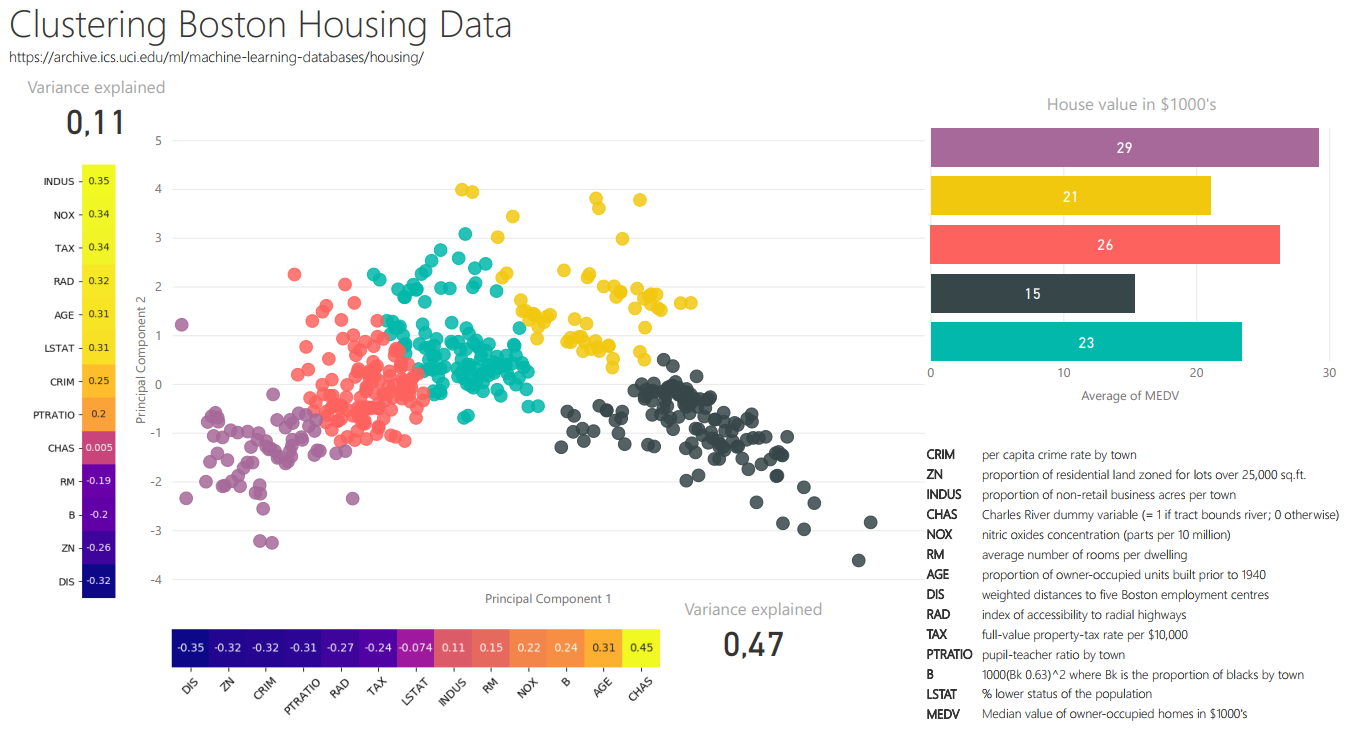
Muy interesante la nueva funcionalidad que permite el uso de Python en PowerBI, que se añade a la ya conocida capacidad con R, que os comentábamos no hace mucho En este artículo de Tommi Ranta explica paso a paso como preparar un entorno Python, habilitar Python en Power BI, importar datos y aplicar clustering a los datos y crear visualización personalizadas en Power BI utilizando Python. Todo el material necesario para replicar...
Como integrar Salesforce y PowerBI
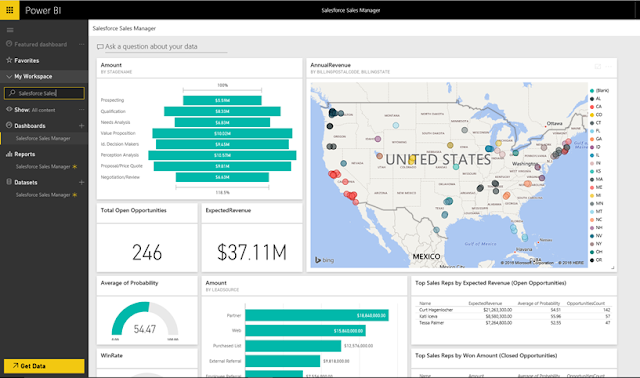
Os contamos las posibilidades de integración de las dos soluciones Business Intelligence y CRM más extendidas del mercado: PowerBI y Salesforce Gracias a la posibilidad de integración de las herramientas se abre una gran cantidad de posibilidades Ahora puede obtener información en tiempo real de los datos de Salesforce mediante la conexión a través de Power BI Según los principales estudios, tanto Salesforce como Microsoft PowerBI lideran...
Mas de 25 novedades en PowerBI
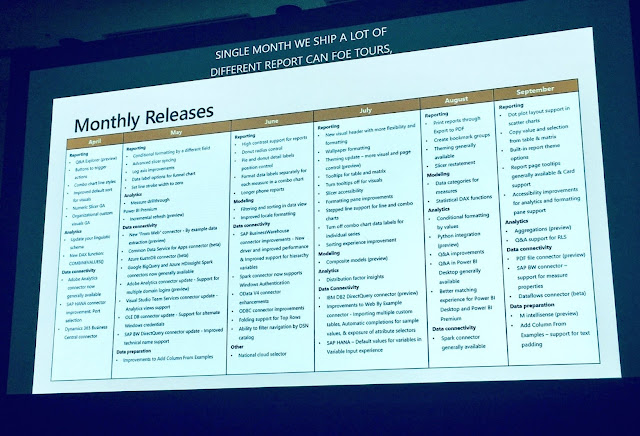
Desde hace ya unos cuantos meses, os venimos contando sobre PowerBI, la herramienta de Data Discovery que cubre las necesidades para crear Dashboards, por parte de usuarios finales y avanzados. Además, para tener una solución completa BI y Analytics, puedes complementarla con soluciones Open Source como Pentaho, LinceBI y todo tipo de integraciones Machine Learning y Big Data Mas información sobre PowerBI (cursos, buenas prácticas, integración) Ultimas...
Videotutorial: Usando R para Machine Learning con PowerBI
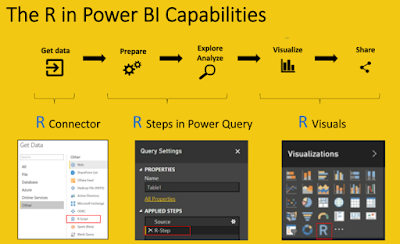
Si te gusta el Business Intelligence, Machine Learning y conoces algo de R, no te puedes perder este Videotutorial: Temario del Videotutorial: 1º Posibilidades de R dentro de Power BI 2º Instalar R y RStudio 3º Matriz de Correlación para el sector Retail 4º Árbol Decisión Titanic 5º Clustering K-Means Estados Unidos 6º Clustering DBSCAN Estados Unidos para detectar Outliers 7º Forecasting Exponencial Smoothing...
Las 50 claves para aprender y conocer PowerBI
Si tenéis curiosidad por conocer sobre todas las posibilidades de PowerBI, como funciona, integración, costes, etc... no te puedes perder este documento. Altamente recomendable!!! También te puede interesar: Las 50 claves para conocer Futbol Analytics julio 18, 2018 Analytics, big data, open source, Stratebi, Tablero Futbolero No comments Os presentamos un estudio muy...
↧
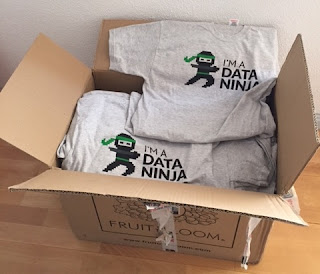
Cool t-shirts for Analytics fans
Our colleagues from Stratebi have made us a very cool gift. Some t-shirts for fans of Analytics: Data Ninja, Dashboards Samurai, Data Mining Jedi, and Big Data Hulk
Hope to share them with all our course students
![]()
![]()
![]()
![]()
![]()
Hope to share them with all our course students


↧
↧
Los 30 mejores proyectos de Machine Learning Open Source
Como sabéis, el Machine Learning es uno de los temas que más nos interesan en el Portal y, máxime, cuando gran parte de las tecnologías son Open Source. En esta entrada, os indicamos los 30 proyectos más interesantes en en este año.
Os dejamos también el material que publicamos con las claves del Machine Learning y una introducción
Ver también, VideoTutorial
No 1
FastText: Library for fast text representation and classification. [11786 stars on Github]. Courtesy of Facebook Research

……….. [ Muse: Multilingual Unsupervised or Supervised word Embeddings, based on Fast Text. 695 stars on Github]
No 2
Deep-photo-styletransfer: Code and data for paper “Deep Photo Style Transfer” [9747 stars on Github]. Courtesy of Fujun Luan, Ph.D. at Cornell University

No 3
The world’s simplest facial recognition api for Python and the command line [8672 stars on Github]. Courtesy of Adam Geitgey


No 5
Sonnet: TensorFlow-based neural network library [5731 stars on Github]. Courtesy of Malcolm Reynolds at Deepmind
No 6
deeplearn.js: A hardware-accelerated machine intelligence library for the web [5462 stars on Github]. Courtesy of Nikhil Thorat at Google Brain


No 8
Pysc2: StarCraft II Learning Environment [3683 stars on Github]. Courtesy of Timo Ewalds at DeepMind

No 9
AirSim: Open source simulator based on Unreal Engine for autonomous vehicles from Microsoft AI & Research [3861 stars on Github]. Courtesy of Shital Shah at Microsoft

No 10
Facets: Visualizations for machine learning datasets [3371 stars on Github]. Courtesy of Google Brain

No 12
Tensor2Tensor: A library for generalized sequence to sequence models — Google Research [3087 stars on Github]. Courtesy of Ryan Sepassi at Google Brain
No 13
Image-to-image translation in PyTorch (e.g. horse2zebra, edges2cats, and more) [2847 stars on Github]. Courtesy of Jun-Yan Zhu, Ph.D at Berkeley
No 14
Faiss: A library for efficient similarity search and clustering of dense vectors. [2629 stars on Github]. Courtesy of Facebook Research
No 15
Fashion-mnist: A MNIST-like fashion product database [2780 stars on Github]. Courtesy of Han Xiao, Research Scientist Zalando Tech

No 16
ParlAI: A framework for training and evaluating AI models on a variety of openly available dialog datasets [2578 stars on Github]. Courtesy of Alexander Miller at Facebook Research


No 18
Pyro: Deep universal probabilistic programming with Python and PyTorch [2387 stars on Github]. Courtesy of Uber AI Labs

No 20
Deep-image-prior: Image restoration with neural networks but without learning [2188 stars on Github]. Courtesy of Dmitry Ulyanov, Ph.D at Skoltech

No 21
Face_classification: Real-time face detection and emotion/gender classification using fer2013/imdb datasets with a keras CNN model and openCV. [1967 stars on Github].
No 22
Speech-to-Text-WaveNet : End-to-end sentence level English speech recognition using DeepMind’s WaveNet and tensorflow [1961 stars on Github]. Courtesy of Namju Kim at Kakao Brain

No 23
StarGAN: Unified Generative Adversarial Networks for Multi-Domain Image-to-Image Translation [1954 stars on Github]. Courtesy of Yunjey Choi at Korea University

No 24
Ml-agents: Unity Machine Learning Agents [1658 stars on Github]. Courtesy of Arthur Juliani, Deep Learning at Unity3D
No 25
DeepVideoAnalytics: A distributed visual search and visual data analytics platform [1494 stars on Github]. Courtesy of Akshay Bhat, Ph.D at Cornell University


No 27
Pix2pixHD: Synthesizing and manipulating 2048x1024 images with conditional GANs [1283 stars on Github]. Courtesy of Ming-Yu Liu at AI Research Scientist at Nvidia

No 28
Horovod: Distributed training framework for TensorFlow. [1188 stars on Github]. Courtesy of Uber Engineering

No 29
AI-Blocks: A powerful and intuitive WYSIWYG interface that allows anyone to create Machine Learning models [899 stars on Github].


Visto en: Medium.mybridge.com
↧
Comparativa de herramientas Business Intelligence

Os presentamos un Estudio muy completo de unas 300 páginas que han realizado nuestros compañeros especialistas en Business Intelligence, Stratebi, con una comparativa y análisis detallados de algunas de las herramientas Business Intelligence que más aceptación están teniendo ultimamente:
- PowerBI
- Tableau
- Qlikview
- Pentaho
- SAS
- Information Builders
- Amazon Quicksight
Un estudio muy completo para todos los interesados en implementar una solución business intelligence
↧
Guide: Machine Learning for Software Engineers
Based on How I plan to become a machine learning engineer, you can/should follow this course if your are interested on this topics:
Table of Contents
- What is it?
- Why use it?
- How to use it
- Follow me
- Don't feel you aren't smart enough
- About Video Resources
- Prerequisite Knowledge
- The Daily Plan
- Motivation
- Machine learning overview
- Machine learning mastery
- Machine learning is fun
- Inky Machine Learning
- Machine Learning: An In-Depth Guide
- Stories and experiences
- Machine Learning Algorithms
- Beginner Books
- Practical Books
- Kaggle knowledge competitions
- Video Series
- MOOC
- Resources
- Becoming an Open Source Contributor
- Games
- Podcasts
- Communities
- Conferences
- Interview Questions
- My admired companies
↧
Las 7 personas que necesitas en tu equipo de datos

Great and funny data info in Lies, Damned Lies
1. The Handyman
Just make sure you don’t accidentally end up with a thousand people accessing the database he’s hosting under his desk every month for your month-end financial reporting (ahem).
Really good handymen are pretty hard to find, but you may find them lurking in the corporate IT department (look for the person everybody else mentions when you make random requests for stuff), or in unlikely-seeming places like Finance. He’ll be the person with the really messy cubicle with half a dozen servers stuffed under his desk.
The talents of the Handyman will only take you so far, however. If you want to run a quick and dirty analysis of the relationship between website usage, marketing campaign exposure, and product activations over the last couple of months, he’s your guy. But for the big stuff you’ll need the Open Source Guru.
2. The Open Source Guru.
Open Source Gurus share many characteristics in common with that most beloved urban stereotype, the Hipster. They profess to be free of corrupting commercial influence and pride themselves on plowing their own furrow, but in fact they are subject to the whims of fashion just as much as anyone else. Exhibit A: The enormous fuss over the world-changing effects of Hadoop, followed by the enormous fuss over the world-changing effects of Spark. Exhibit B: Beards (on the men, anyway).
So be wary of Gurus who ascribe magical properties to a particular technology one day (“Impala’s, like, totally amazing”), only to drop it like ombre hair the next (“Impala? Don’t even talk to me about Impala. Sooooo embarrassing.”) Tell your Guru that she’ll need to live with her recommendations for at least two years. That’s the blink of an eye in traditional IT project timescales, but a lifetime in Internet/Open Source time, so it will focus her mind on whether she really thinks a technology has legs (vs. just wanting to play around with it to burnish her resumé).
3. The Data Modeler
While your Open Source Guru can identify the right technologies for you to use to manage your data, and hopefully manage a group of developers to build out the systems you need, deciding what to put in those shiny distributed databases is another matter. This is where the Data Modeler comes in.
The Data Modeler can take an understanding of the dynamics of a particular business, product, or process (such as marketing execution) and turn that into a set of data structures that can be used effectively to reflect and understand those dynamics.
Data modeling is one of the core skills of a Data Architect, which is a more identifiable job description (searching for “Data Architect” on LinkedIn generates about 20,000 results; “Data Modeler” only generates around 10,000). And indeed your Data Modeler may have other Data Architecture skills, such as database design or systems development (they may even be a bit of an Open Source Guru).
But if you do hire a Data Architect, make sure you don’t get one with just those more technical skills, because you need datasets which are genuinely useful and descriptive more than you need datasets which are beautifully designed and have subsecond query response times (ideally, of course, you’d have both). And in my experience, the data modeling skills are the rarer skills; so when you’re interviewing candidates, be sure to give them a couple of real-world tests to see how they would actually structure the data that you’re working with.
4. The Deep Diver
Deep Divers (often known as Data Scientists) love to spend time wallowing in data to uncover interesting patterns and relationships. A good one has the technical skills to be able to pull data from source systems, the analytical skills to use something like R to manipulate and transform the data, and the statistical skills to ensure that his conclusions are statistically valid (i.e. he doesn’t mix up correlation with causation, or make pronouncements on tiny sample sizes). As your team becomes more sophisticated, you may also look to your Deep Diver to provide Machine Learning (ML) capabilities, to help you build out predictive models and optimization algorithms.
If your Deep Diver is good at these aspects of his job, then he may not turn out to be terribly good at taking direction, or communicating his findings. For the first of these, you need to find someone that your Deep Diver respects (this could be you), and use them to nudge his work in the right direction without being overly directive (because one of the magical properties of a really good Deep Diver is that he may take his analysis in an unexpected but valuable direction that no one had thought of before).
For the second problem – getting the Deep Diver’s insights out of his head – pair him with a Storyteller (see below).
5. The Storyteller
Finding a good Storyteller is pretty challenging. You do want someone who understands data quite well, so that she can grasp the complexities and limitations of the material she’s working with; but it’s a rare person indeed who can be really deep in data skills and also have good instincts around communications.
The thing your Storyteller should prize above all else is clarity. It takes significant effort and talent to take a complex set of statistical conclusions and distil them into a simple message that people can take action on. Your Storyteller will need to balance the inherent uncertainty of the data with the ability to make concrete recommendations.
Another good skill for a Storyteller to have is data visualization. Some of the most light bulb-lighting moments I have seen with data have been where just the right visualization has been employed to bring the data to life. If your Storyteller can balance this skill (possibly even with some light visualization development capability, like using D3.js; at the very least, being a dab hand with Excel and PowerPoint or equivalent tools) with her narrative capabilities, you’ll have a really valuable player.
There’s no one place you need to go to find Storytellers – they can be lurking in all sorts of fields. You might find that one of your developers is actually really good at putting together presentations, or one of your marketing people is really into data. You may also find that there are people in places like Finance or Market Research who can spin a good yarn about a set of numbers – poach them.
6. The Snoop
These next two people – The Snoop and The Privacy Wonk – come as a pair. Let’s start with the Snoop. Many analysis projects are hampered by a lack of primary data – the product, or website, or marketing campaign isn’t instrumented, or you aren’t capturing certain information about your customers (such as age, or gender), or you don’t know what other products your customers are using, or what they think about them.
The Snoop hates this. He cannot understand why every last piece of data about your customers, their interests, opinions and behaviors, is not available for analysis, and he will push relentlessly to get this data. He doesn’t care about the privacy implications of all this – that’s the Privacy Wonk’s job.
If the Snoop sounds like an exhausting pain in the ass, then you’re right – this person is the one who has the team rolling their eyes as he outlines his latest plan to remotely activate people’s webcams so you can perform facial recognition and get a better Unique User metric. But he performs an invaluable service by constantly challenging the rest of the team (and other parts of the company that might supply data, such as product engineering) to be thinking about instrumentation and data collection, and getting better data to work with.
The good news is that you may not have to hire a dedicated Snoop – you may already have one hanging around. For example, your manager may be the perfect Snoop (though you should probably not tell him or her that this is how you refer to them). Or one of your major stakeholders can act in this capacity; or perhaps one of your Deep Divers. The important thing is not to shut the Snoop down out of hand, because it takes relentless determination to get better quality data, and the Snoop can quarterback that effort. And so long as you have a good Privacy Wonk for him to work with, things shouldn’t get too out of hand.
7. The Privacy Wonk
The Privacy Wonk is unlikely to be the most popular member of your team, either. It’s her job to constantly get on everyone’s nerves by identifying privacy issues related to the work you’re doing.
You need the Privacy Wonk, of course, to keep you out of trouble – with the authorities, but also with your customers. There’s a large gap between what is technically legal (which itself varies by jurisdiction) and what users will find acceptable, so it pays to have someone whose job it is to figure out what the right balance between these two is.
But while you may dread the idea of having such a buzz-killing person around, I’ve actually found that people tend to make more conservative decisions around data use when they don’t have access to high-quality advice about what they can do, because they’re afraid of accidentally breaking some law or other. So the Wonk (much like Sadness) turns out to be a pretty essential member of the team, and even regarded with some affection.
Of course, if you do as I suggest, and make sure you have a Privacy Wonk and a Snoop on your team, then you are condemning both to an eternal feud in the style of the Corleones and Tattaglias (though hopefully without the actual bloodshed). But this is, as they euphemistically say, a “healthy tension” – with these two pulling against one another you will end up with the best compromise between maximizing your data-driven capabilities and respecting your users’ privacy.
Bonus eighth member: The Cat Herder (you!)The one person we haven’t really covered is the person who needs to keep all of the other seven working effectively together: To stop the Open Source Guru from sneering at the Handyman’s handiwork; to ensure the Data Modeler and Deep Diver work together so that the right measures and dimensionality are exposed in the datasets you publish; and to referee the debates between the Snoop and the Privacy Wonk.
This is you, of course – The Cat Herder. If you can assemble a team with at least one of the above people, plus probably a few developers for the Open Source Guru to boss about, you’ll be well on the way to unlocking a ton of value from the data in your organization.
Visto en: Lies, Damned Lies
↧
↧
6 motivos para llevar tu BI a la nube y 1 por el que no

Esto limita las posibilidades para llevar tu Business Intelligence al cloud o tener un BI Corporativo con las ventajas de ambos modelos.
Os vamos a contar 6 motivos por los que puedes llevar tu BI a la nube y uno por el que no:
1. Reducción de Costes
Si te adaptas a las características de las soluciones BI que te proponen muchas empresas, con los límites, niveles premium, etc... puedes conseguir unos precios mensuales/anuales muy buenos por usuario
2. Aumentar los recursos, según se necesiten
En negocios y sectores en los que puedes tener variaciones en las concurrencias de uso muy altas, incrementos de volumenes de datos en determinados periodos, análisis real-time puntuales, etc... la posibilidad de asignar más recursos de forma fléxible es una gran ventaja
3. Desarrollos más ágiles
El no tener que depender de las áreas de sistemas, o de la disponibilidad de hardware en tiempo y capacidad de forma adecuada, hace que los desarrollos de proyectos e implementación se puedan demorar en gran manera
4. Entornos compatibles
Llevar tu BI a la nube te puede permitir tener algunos componentes y conectores desplegados de forma nativa, referentes a redes sociales, machine learning, bases de datos, etc...
5. Seguridad y Disponibilidad
Aunque no tener los datos en tus propias máquinas puede darte qué pensar, lo cierto, es que muchas compañías, para gran cantidad de información tienen más seguridad de no perderla o de tener brechas si confían en un entorno en la nube que en sus organizaciones internas, de las que no confían tanto
6. Acceso desde cualquier lugar y momento
Cada vez más, desde que se produjo la democratización del Business Intelligence y más usuarios, analistas, etc... hacen uso de los sistemas BI desde todo tipo de redes, accesos, dispositivos móviles... los entornos en la nube pueden garantizar un acceso común y similar para cada uno de ellos

Y por qué no mover a la nube?
Todas esas ventajas tienen el inconveniente de que si quieres desplegar el BI 'on premise', en tus propios entornos, controlando los datos sensibles y accesos, te topas con que el coste de las correspondientes licencias se dispara hasta niveles increíbles.
Es el 'peaje' a pagar, por salirte del camino marcado en la nube por los grandes proveedores.
Salvo que.... y esa es la gran ventaja del modelo open source o sin coste de licencias, que se está extendiendo, que puedas desplegarlo 'on premise' o en una 'nube privada', controlada por tí, con todas las ventajas anteriores, más la de ahorro de costes.
Confía en las soluciones BI Open Source o sin coste de licencias y que tener tu BI en la nube o 'on premise' no sea un problema
↧
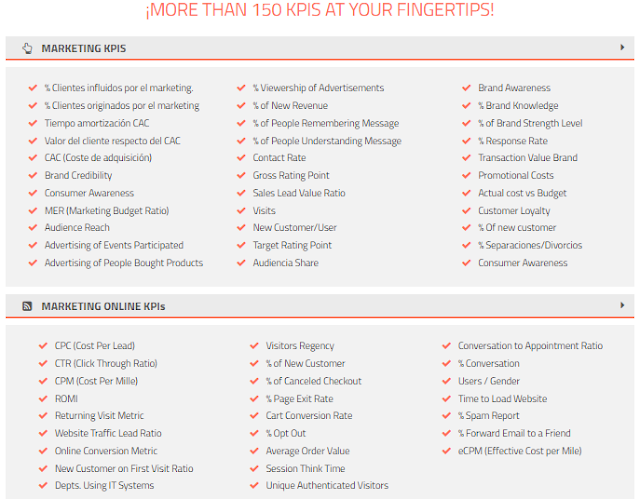
Marketing Analytics, Open Source based Solution


Analytic Reporting
- PC, Tablet, Smartphone compatibility
- Syncs your analysis with other users
- Download information on your device
- Make better decisions anywhere and anytime
Alerts
- Configure your threshold
- Mapping alerts and business rules
- Planning actions when an event happen
Marketing KPIs:

↧
Web Reporting open source based tool

You can use it 'standalone', with some BI solutions like Pentaho (check online Demo), suiteCRM, Odoo... or as a part of predefined solutions like LinceBI
You can see STReport main new functionalities on this video including:
- Graph support
- Indentify cardinality of elements
- Parameter filter for end users access
- Cancel execution of long queries
- Upgraded to new Pentaho versions
- Many other minor enhacements and bugs fixed
Contact info
↧
PowerBI + Open Source = Sports Analytics
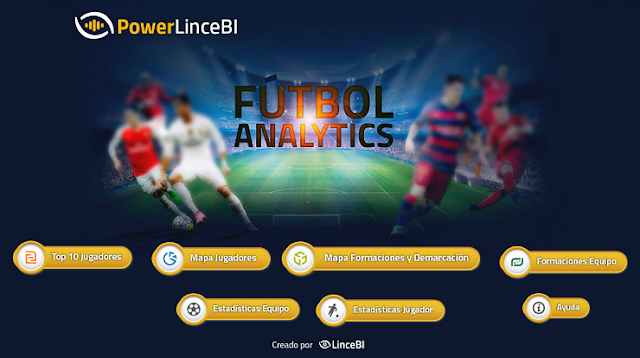
Here you can see a nice sample combining PowerBI with open source based Business Intelligence solutions, like LinceBI, in order to provide the most complete BI solution with an affordable cost
- Predefined Dashboards
- Adhoc Reporting
- OLAP Analysis
- Adhoc Dashboarding
- Scorecards
More info:
- PowerBI functionalities
- PowerBI training
↧
↧
Comparativa Kettle (Pentaho Data Integration) y Talend
Hace unos días os hablábamos de que el ETL es crucial y hoy os mostramos una comparativa de las dos mejores herramientas Open Source de ETL (Kettle de Pentaho y Talend), que tampoco empieza a ser arriesgado a decir que se están convirtiendo en las mejores, sobre todo si valoramos el coste y la posibilidad de integración y modificación respecto a Informatica Powercenter, Oracle, Microsoft o IBM
Tanto Kettle como Talend son grandes herramientas, muy visuales, que nos permiten integrar todo tipo de fuentes, incluyendo también Big Data para hacer todo tipo de transformaciones y proyectos de integración o para preparar potentes entornos analíticos, también con soluciones Open Source como podéis ver en esta Demo Online, donde se han usado Kettle y Talend en el backend
![]()
![]()
![]()
![]()
Descargar la comparativa de Excella
Tanto Kettle como Talend son grandes herramientas, muy visuales, que nos permiten integrar todo tipo de fuentes, incluyendo también Big Data para hacer todo tipo de transformaciones y proyectos de integración o para preparar potentes entornos analíticos, también con soluciones Open Source como podéis ver en esta Demo Online, donde se han usado Kettle y Talend en el backend


↧
Metodologias Agiles para Analytics (Business Intelligence, Big Data)

En este post, os vamos a contar como hacer proyectos ágiles en Analytics (Business Intelligence/Big Data Analytics). Realmente, os vamos a contar unos tips o consejos que cada vez más usamos y que nos cuenta Emilio Arias de Stratebi.
Tradicionalmente, este enfoque se ha aplicado más a proyectos en los que el componente de 'desarrollo' tiene un peso muy importante y se hace muy difícil aplicarlo al BI/DW, donde los requisitos, el manejo de datos de negocio y la participación de perfiles de interlocutores muy diversos lo hace muy difícil.
A. El enfoque tradicional de planificación en BI/DW
- La planificación de proyectos en cascada (con diagramas de Gantt) que todos conocéis (lleva usándose más de 70 años) se ha demostrado imperfecto a la hora de conseguir que un proyecto BI sea exitoso. Que quiere decir 'un proyecto BI exitoso'? quiere decir 'que se use' por la mayor parte de la organización y es porque les ofrece 'lo que necesitan'
- Los diferentes planteamientos teóricos de construcción (Kimball, Inmon, Data Vault) se han demostrado muy útiles para reflejar el diagrama de modelos y almacenes de datos, pero la ejecución en el día a día, nos ha demostrado que se requieren enfoques ágiles para llevarlos a la práctica

- Los problemas surgen pues 'Cómo se había hecho una planificación', 'con muchos meses por delante', cuando surge un problema de arquitectura, de volumen, cambio de requerimientos, mejoras de software... el encaje y respuesta rápida se hace imposible
- Al ser proyectos con un alcance ya cerrado y difícil de cambiar, 'proyectos caja negra', los usuarios e interesados en el proyecto no lo sienten como suyo, generando reticencias sobre su uso, al no sentirse partícipes, pues sus propuestas y sugerencias, 'suelen llegar tarde'
B. Los 20 puntos clave para un proyecto Agile BI/DW
1. Haz prototipos (antes, durante y después). No dejes de hacerlos, son la mejor herramienta para garantizar que se va en el buen camino
2. Ten un entorno preparado para los prototipos rápidos (entorno en la nube, componentes predefinidos, procesos automatizados...)
3. Usa metodologías ágiles. Hay muchas... (scrum...), lo más importante es el cambio de mentalidad y empezar a usarlas
4. La regla de oro: mejor rehacer un 30% ahora que un 100% dentro de 6 meses. No tengas miedo a que te hagan cambios en los prototipos. Siempre será mejor que ir a ciegas
5. Todo el equipo se siente implicado desde el momento inicial. Y sienten que sus opiniones cuentan
6. La tradicional batalla entre usuarios-IT-Consultores, por sus diferentes prioridades, se minimiza al colaborar desde momentos muy tempranos y con la tranquilidad de que 'hay tiempo para corregir errores'
7. En este tipo de proyectos, encontrar un 'product owner' es complicado, pero lo tenéis que hacer. Debe ser de negocio
8. Solventa cuanto antes los puntos de fricción 'top-down', 'down-top', desde la importancia de la calidad del datos, los procesos ETL y los metadatos a los análisis de negocio en tiempo real, KPIs, etc... (en el punto intermedio, todos los participantes deberán alinearse)
9. Haz los planes de pruebas no al final, sino al día siguiente de empezar
10. Necesitas un Project Manager (el que está al tanto de todo, conoce a todos, convoca y resume las reuniones, etc...) Necesitas una cabeza visible y clara que todos 'identifiquen con el proyecto'
11. Mide y cuenta los avances, genera satisfacción con lo conseguido

13. Nunca pongas la presentación de un hito, avance, etc.. un lunes por la mañana (es de malos gestores, contar con el fin de semana de colchón) y genera ansiedades
14. Usa el BI (cubos, dashboards..) de forma ágil para validar rápidamente la calidad de los datos, tiempos de ejecución, etc... BI por partida doble
15. Deja que los usuarios se acerquen al BI. Desde las fases iniciales pierde el miedo a que accedan, toquen, rompan, se frustren, se sorprendan, se quejen de lo que van viendo...
16. No dejes el diseño y usabilidad para el final. Aunque pienses que es secundario y posterior, deber ir paralelo al desarrollo. Si no lo haces, la implicación de usuarios decaerá enormemente
17. Con AgileBI vas a tener que seguir documentando (de otra forma, con herramientas online (trello, podio, etc...), pero lo harás
18. Con AgileBI se necesita más disciplina, no menos. Esto es muy importante. Se asocia a cierto caos y es todo lo contrario. Se trata de trabajar como los mecánicos que cambian las ruedas en Formula 1
19. Tienes que tener a la gente motivada en el proyecto (esto se consigue con todo lo anterior), pero si haces todo lo anterior y no están motivados, 'el problema eres tú'
20. Un proyecto BI/DW nunca, nunca, nunca se acaba. Si lo das por acabado, también será un fracaso
Adenda: Si usas BI Open Source (por su flexibilidad, ahorro de costes e integración), tienes 'muchos' más puntos para conseguir tu objetivo
Te puede interesar:
- Big Data para Dummies
- Comparativa de herramientas Business Intelligence
- Descarga gratuita del Libro de un buen amigo y gran especialista, Roberto Canales: 'Transformacion Digital y Metodologías Agiles'
- Así se convierten los datos en conocimiento
- Como aprender Big Data en dos horas
↧
Ebook gratuito, La Consultoria con Humor

Ya podéis bajaros el libro de 'La Gacela de Wirayut' para leer en vuestro tablet preferido de forma gratuita, en formato pdf.
A todos los que habéis trabajado, trabajais en el mundo de la consultoría, o habéis tratado con consultores, seguro que hay muchas cosas que os resultan familiares.
Se da un repaso a la inutilidad de muchas reuniones de trabajo, la relación con los jefes, el uso del e-mail y de internet, la hipocresía en muchas empresas.
Un apasionante viaje a las profundidades de las empresas. Lugares en donde pasamos gran parte de nuestra vida sin comprender realmente que hacemos allí. Esperemos que os guste y además gratis!!
¿Te llevas bien con tu jefe o solo disimulas?, ¿Utilizas Internet para temas relacionados con tu trabajo o con tu ocio?, ¿Alguna vez has trabajado en el extranjero sin saber apenas inglés?
Indice
1. De moquetas y despachos
2. Tienes un e-mail
3. Haciendo amigos (seguridad, limpieza, mantenimiento)
4. Que bien.... reunión
5. Trabajar en el extranjero (Como Tarzán en Sarajevo)
6. En tierra extraña (cuando se llega a una empresa ‘cliente’)
7. El Alien ‘ado’
8. Reuniones anuales, Kick-offs
9. ¿Un coffee y hablamos?
10. Internet... no se puede estar sin él
11. Momento Rocky Balboa
↧
30 años del Data Warehouse

Justo ahora hace 30 años que Barry Devlin publicó el primer artículo describiendo la arquitectura de un Data Warehouse
Descargate el histórico artículo
Original publication: “An architecture for a business and information system”, B. A. Devlin, P. T. Murphy, IBM Systems Journal, Volume 27, Number 1, Page 60 (February, 1988)

↧
↧
Libro gratuito: Ultimate Guide To Data Science Interviews
What’s inside?
90 pages of original research, interviews with real data scientists and hiring managers at some of the best data science teams on earth, as well as recruiters and successful candidates who are now data scientists, and actionable checklists. We’ll walk you, step-by-step through everything you need to know to ace the data science interview.
- You’ll start by understanding the different roles and industries within data science so you can apply for jobs that are the best fit for you.
- Next, you’ll learn how to apply for these jobs to maximize your chances of getting an interview.
- Then, you’ll go over every step of the data science interview process so that you can prepare for what’s coming.
- Next, you’ll get free sample questions that cover the categories of questions you can expect to receive, which you can use to practice how you approach the data science interview.
- Then, you’ll get advice on what to do after the interview to move the process forward.
- Finally, you’ll know what to do if you’re juggling between different offers.
Table of Contents:
Introduction
What is Data Science?
Different Roles within Data Science
How Different Companies Think About Data Science:
- Earlystage startups (200 employees or fewer) looking to build a data product
- Earlystage startups (200 employees or fewer) looking to take advantage of their data
- Midsize and large Fortune 500 companies who are looking to take advantage of their data
- Large technology companies with well established data teams
Industries that employ Data Scientists
Getting a Data Science Interview
Nine Paths to a Data Science Interview
Traditional Paths to Job Interviews:
- Data Science Job Boards and Standard Job Applications
- Work with a Recruiter
- Go to Job Fairs
Proactive Paths to Job Interviews:
- Attend or Organize a Data Science Event
- Freelance and Build a Portfolio
- Get Involved in Open Data and Open Source
- Participate in Data Science Competitions
- Ask for Coffees, do Informational Interviews
- Attend Data Hackathons
Working with Recruiters
- How to Apply
- CV vs LinkedIn
- Cover Letter vs Email
- How to get References and Your Network to Work for You
- Preparing for the Interview
What to Expect:
- The Phone Screen
- Takehome Assignment
- Phone Call with a Hiring Manager
- Onsite Interview with a Hiring Manager
- Technical Challenge
- Interview with an Executive
What a data scientist is being evaluated on
- The Categories of Data Science Questions
- Behavioral Questions
- Mathematics Questions
- Statistics Questions
- Scenario Questions
- Tackling the Interview
- Conclusion
What Hiring Managers are Looking For:
- Interview with Will Kurt (Quick Sprout)
- Interview with Matt Fornito (OpsVision Solutions)
- Interview with Andrew Maguire (PMC/Google/Accenture)
- Interview with Hristo Gyoshev (MasterClass)
- Conclusion
How Successful Interviewees Made It:
- Sara Weinstein
- Niraj Sheth
- Sdrjan Santic
- Conclusion
7 Things to Do After The Interview:
- Send a followup thank you note
- Send them thoughts on something they brought up in the interview
- Send relevant work/homework to the employer
- Keep in touch, the right way
- Leverage connections
- Accept any rejection with professionalism
- Keep up hope
The Offer Process
- Handling Offers
- Company Culture
- Team
- Location
- Negotiating Your Salary
- Facts and Figures
- Taking the Offer to the Best First Day
- Reaching out to get a referral
- Following up after an interview
↧
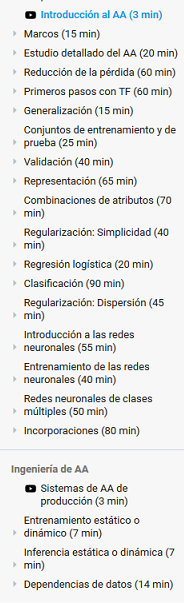
Curso gratuito de Machine Learning por Google
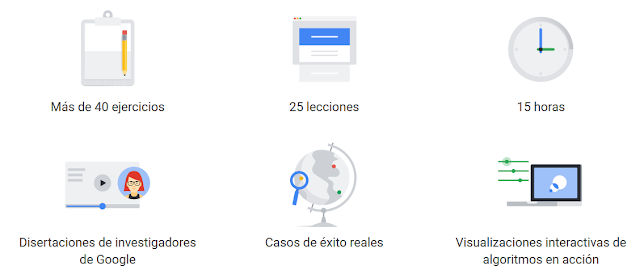
Gran curso el que ofrece Google sobre Machine Learning, aprendizaje automático. Os lo recomendamos (Curso)
Mas sobre Machine Learning:
- Las 53 claves para conocer Machine Learning
↧
Quieres trabajar en Big Data/Analytics y tienes ganas de aprender?

Tenemos un plan de formación y carrera para profesionales con una base inicial y muchas ganas de aprender. Escríbenos a rrhh@stratebi.com (Octubre 2019)
Podrás participar en proyectos y en desarrollos con las tecnologías más modernas, como Dashboards en tiempo real.
Hemos creado también la solución LinceBI, que está revolucionando el Business Intelligence basado en open source
El trabajo puede ser presencial en Madrid o remoto, en cualquier parte del globo, :-)

Ejemplo de Wall Dashboard real time que desarrollamos
· Requisitos:
o Descripción: Una persona con interés en Business Intelligence y Big Data, no es necesaria mucha experiencia, pero con ganas de aprender y formar equipo. Por ejemplo, i), una persona que acabe de terminar una Ingeniería Informática y/o su trabajo de fin de carrera sea sobre Big Data/Business Intelligence, ii), una persona que esté haciendo I+D en Big Data/Business Intelligence o iii), que haya hecho un máster en Big Data/Business Intelligence o tenga algunos años de experiencia y quiera avanzar en su carrera
o Salario: Según valía
o Habilidades recomendadas:
· Conocimientos teóricos básicos de Big Data.
o Qué es el Big Data.
o Debe tener claro el paradigma Map Reduce.
· Conocimientos teóricos básicos de las siguientes tecnologías de arquitectura Hadoop.
o HDFS
o Spark
· Conocimientos teóricos sobre Machine Learning.
· Programación en i) Python y ii) Scala o Java para Machine Learning, con mínima experiencia demostrable
· Conocimiento de Bases de Datos
o Soltura con lenguaje SQL.
o Modelado relacional.
o Experiencia mínima demostrable en al menos uno de los siguientes SGBD:
§ MySQL
§ PostgreSQL
§ Microsoft SQLServer
§ Oracle
§ Opcionales (alguno de estos conocimientos serían muy interesantes):
· (+) Conocimientos teóricos básicos de arquitectura Hadoop.
o Hive
o HBase
o Kafka
o Flume
o Distribuciones Cloudera o Hortonworks:
§ Características
§ Instalación.
· Conocimientos teóricos Business Intelligence
o Teoría de Data Warehouses.
§ Modelado en estrella.
· Experiencia con alguna herramienta de ETL.
o Ideal con Pentaho Data Integration o Talend
o Cualquier otra.
· Experiencia en diseño y carga de un Data Warehouse.
↧